#004 - Tool Talk: Hello, Trace Viewer
Last updated: Dec 21, 2021
Welcome to Day 4 of #30DaysOfPlaywright!!

In our last post we looked at how to setup a demo app as a real-world testbed for Playwright. See the source code and visit the running site for reference.
Today, we’ll kick off a series of “Tool Talk” blog posts that use this app as a sandbox to learn about the authoring, debugging, profiling, and command-line, tools provided by the Playwright framework. Our tool focus today: Trace Viewer!
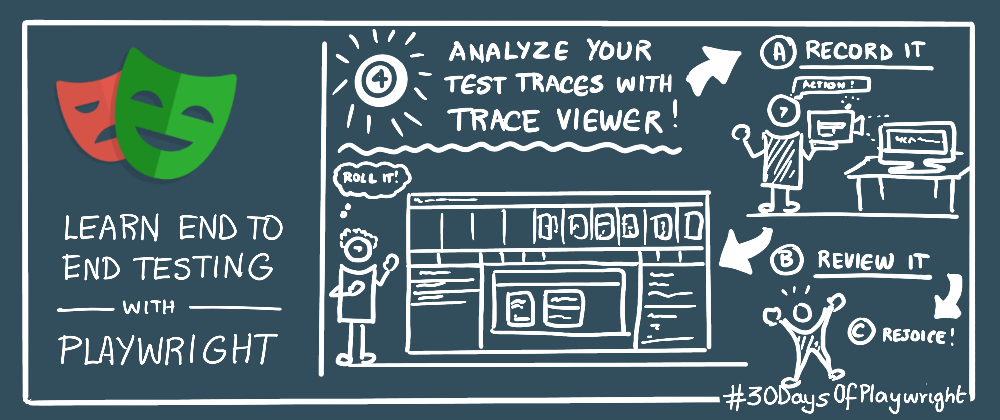
Here’s a handy visual guide to the Trace Viewer docs. You can download the hi-res image here or see a time-lapse of how this was created here

Recap | The Recipes4AJ App Sandbox
In the last post we built and deployed a recipe blog app, and configured GitHub actions to automate the build-deploy-test workflow. As part of that process, we did a couple of things that relate to this post:
- We customized the Playright configuration and test script files.
- We ran tests locally to validate Playwright setup.
- We saw a show report link provided when the test run completed.
Today, we want to dive into that last part and understand what “show report” does, and dive into details on the Trace Viewer tool that plays a key role.
Review | Test Configuration
First, let’s take a quick look at the project’s playwright.config.js file to understand the default configuration settings. I’ve deliberately omitted a lot of the details from that file and highlighted only the options relevant to today’s post:
const config = {
  testDir: './e2e',

  // See: https://playwright.dev/docs/test-reporters/
  reporter: 'html',

  // See: https://playwright.dev/docs/trace-viewer
  use: {
    actionTimeout: 0,
    trace: 'on',
  },

  // See: https://playwright.dev/docs/api/class-testconfig
  outputDir: 'test-results/',
};
module.exports = config;
Let’s look at the these options in more detail:
-
reporter is set to
html.
Reporters enable Playwright to create custom test reports from a test run. The HTML reporter creates a folder (playwright-report) with report data and code that renders the data in a web page. Playwright offers other built-in reporter options that we’ll explore in the next Tool Talk post. -
outputDir is set to
test-results.
This test configuration parameter defines the location for files created during test execution. The folder is cleaned, and unique subfolders created for each (isolated) test project within the current test run. -
trace is set to
on.
This records a trace for every test (success or failure). Other options areoff(don’t record),on-first-retry(record only for first retried test) andretain-on-failure(record all, then remove traces for successful runs).
Now let’s look at the test script.
Run | Test Script (Locally)
Our customized test script is contained in a spec file (example.spec.js) and defines a single test (basic test) executed for three projects (targeting chromium, firefox and webkit) - as configured in playwright.config.js.
// @ts-check
const { test, expect } = require('@playwright/test');

test('basic test', async ({ page }) => {
  await page.goto('https://bit.ly/recipes-for-aj');
  await expect(page).toHaveTitle("Recipes 4 AJ");

  await page.locator('text=Tags').click();
});
The test script defines three actions:
- navigate to the demo app page
- check if that page has the desired title (
Recipes 4 AJ) - locate the page element matching the selector (
text=Tags) - and click it
Let’s run the test script:
$ cd testing
$ npx playwright test
Using config at <..>/testing/playwright.config.js
Running 3 tests using 3 workers
  3 passed (5s)

To open last HTML report run:
  npx playwright show-report
If you list the local directory, you’ll now find two new folders created: test-results and playwright-report. Let’s take a look at what these contain:
$ ls test-results/*
test-results/example-basic-test-chromium:
trace.zip

test-results/example-basic-test-firefox:
trace.zip

test-results/example-basic-test-webkit:
trace.zip
The test-results directory (above) contains one subfolder for each project run - with the naming convention (e.g., spec name, test name, project name) reducing conflicts for parallel test runs.
$ ls playwright-report/*
playwright-report/index.html

playwright-report/data:
2cbc37ec2b02c3c5606cb8b007dfdc961a7b4a9f.zip
77e362c78816daec1c99e9c8459f6c9ed8e1fa9f.zip
f27c66e32b2332aa356b0e4f175b8a3321986a3e.zip

playwright-report/trace:
40e1017745522c215602.ttf	icon-384x384.png
app.bundle.js			icon-512x512.png
icon-16x16.png			index.html
icon-192x192.png		sw.bundle.js
icon-256x256.png		zip.min.js
icon-32x32.png
The playwright-report directory (above) contains folders with the data per project run (zipfiles), a trace viewer app, and a landing page (index.html) that can be served locally for viewing reports (show-report).
Report | Open the HTML Report (locally)
Let’s view the generated report using the show-report command.
$ npx playwright show-report

Serving HTML report at http://127.0.0.1:9323. Press Ctrl+C to quit.
Check the tweet for a video walkthrough of the report (or grab the file here!)
Alright - this @playwrightweb reporting output is pretty nifty - and I love the built-in trace viewer too. Now you know what my next blog post is all about right?
— Nitya Narasimhan (@nitya) December 9, 2021
Bonus: https://t.co/DpzplITcb4 is a PWA - use it load/view trace files anytime locally (data not sent to server) 🎭 pic.twitter.com/p33K4dmNwv
The HTML Report landing page (shown below) has one (collapsible) section per project test run. It comes with a built-in search bar (for easy filtering and discovery) and has color-coded tags for each browser target (click on tag to scope list down to only tests run on that target type).

Screenshot of Landing Page for HTML Report
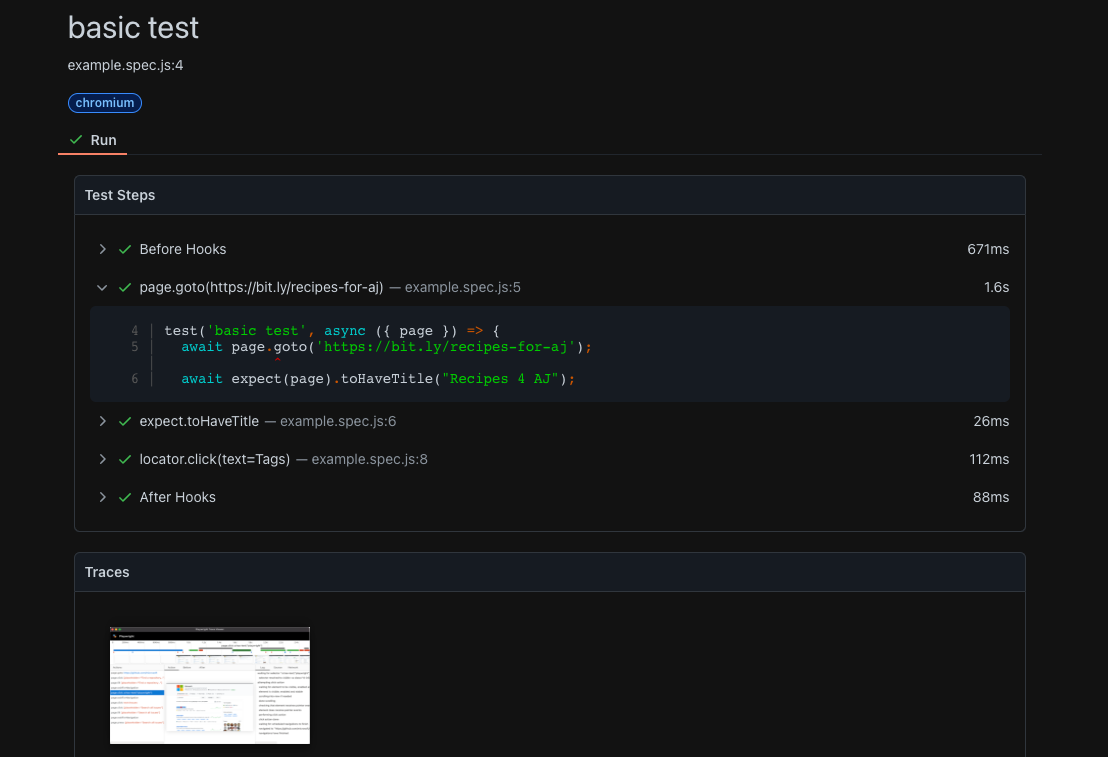
Clicking on a particular test (e.g., the chromium record) takes you to the detailed report for that run (shown below) - listing the actions run and time taken for each, along with a link to its trace.zip file (since we configured Playwright to record all test runs).

Screenshot of chromium project `basic test` run report page
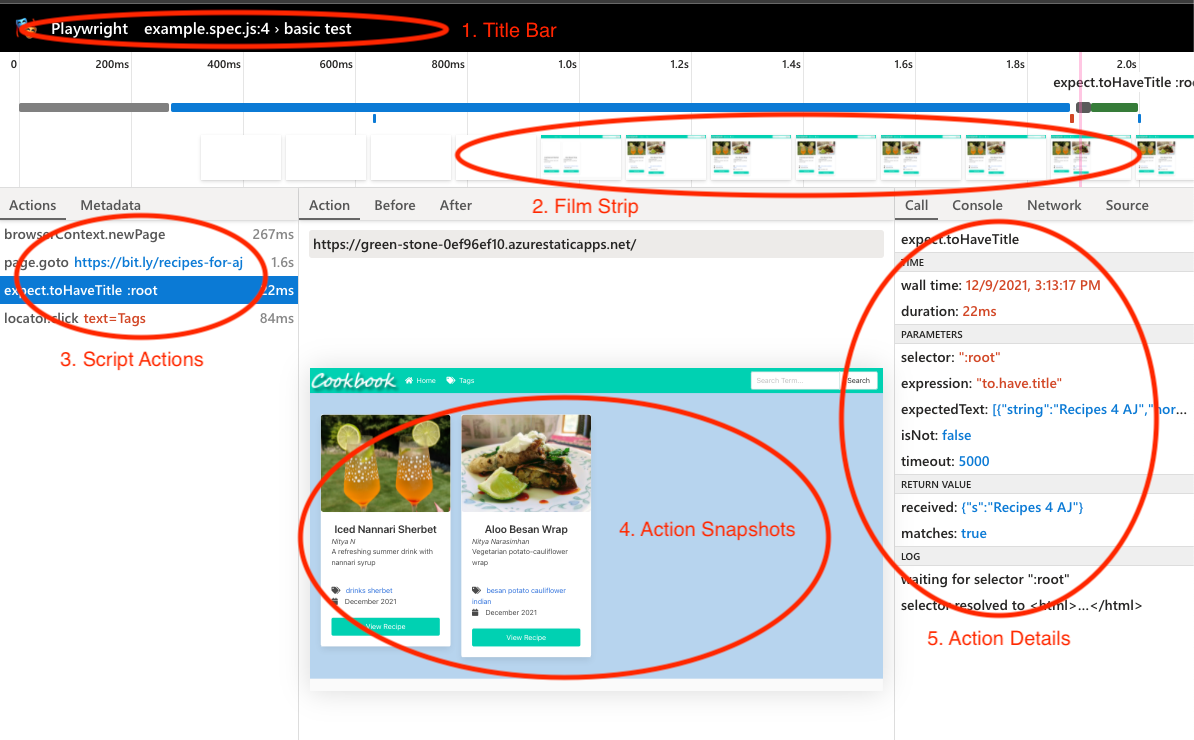
Click on the trace file - and we get to our intended destination for this post! I’ve linked an annotated screenshot of that page below, so we can dive a bit into what this does in the next section.

Screenshot of chromium project `basic test` trace view
🚨 | I’ve saved the trace file here so we can explore this further next!
Trace Viewer | Launch options
Trace Viewer is the built-in GUI-based tool in Playwright that lets you view and analyze the recorded traces from a test run. We already talked about recording options in the configuration file - and know that the trace will be stored in a trace.zip file under the relevant project run subfolder.
Now let’s talk about Viewing options - there are three ways to get to the Trace Viewer page to explore the trace file from a test run.
$npx playwright show-report
run full report, then navigate to Trace view.$npx playwright show-trace trace.zip
launch Trace viewer directly, with local file.$npx playwright show-trace <remote-trace-file>
launch Trace viewer directly, with remote file.
In the last case, try using the previously-stored trace file and see what happens:
$ npx playwright show-trace https://nitya.github.io/learn-playwright/files/003-chromium-trace.zip
You should see a Trace Viewer window popup similar to the screenshot above - allowing you to view and interact with the trace data. This is a great way to analyze an archived trace, debug it collaboratively in a group project.
Trace Viewer (PWA) | trace.playwright.dev
But wait - there’s now a fourth option:
Visit trace.playwright.dev in your browser and drop the trace file to activate the Trace Viewer. This is a great option if you are on a device that does not have Playwright installed, and you have a trace file to analyze.
Want to try it out?
Download the saved trace file from before, then open trace.playwright.dev and drag or upload this zipfile into the specified location on page.
This feature was announced in recently (skip to the 11:44 mark in the video below). Most importantly, it’s a Progressive Web App which opens the trace file locally (no sending trace data to servers) to preserve data privacy.
Trace Viewer | Layout & Components
Refer to the screenshot above that shows the Trace Viewer page launched from the HTML report - or watch the screencast for an interactive walkthrough.
The viewer layout has 5 main areas:
- Title Bar - which shows the test spec file and test name for context
- Film Strip - a timeline showing screenshots of page state as actions run
- Script Actions - panel listing testing actions in current test script
- Action Snapshots - captured DOM snapshots for each action
- Action Details - source location, execution + network logs for each action
Hover over the film strip to get a magnified look at the screenshot
Slide over the strip to see when different elements get rendered, to enable reliable testing. For instance, this trace showed me that font-awesome icons get rendered a fraction of time later than the associated labels.
Selecting screenshots automatically sets context for Actions Panels below
- Script Actions panel = shows the relevant actions at time of screenshot
- Action Details panel = shows call logs and links to source (for test action).
- Snapshots panel = shows DOM state before & after action (for debug).
And that’s it! Visit the Trace Viewer Documentation for more updates.
What’s Next? |Tool Talk with Reporters!
We covered the Trace Viewer tool in today’s Tool Talk post. Tomorrow, we’ll check out Playwright’s support for Test Reporters - from learning available options, to using them effectively (including in automated workflows) - and even building your own custom reporter using the Reporter API.
